Ontario, 2022 data year
Road test pass rates for every DriveTest centre
- All 65 rows of the release, transcribed in full
- Checked against the stored record on 2026-08-27
- No account, no payment, nothing gated
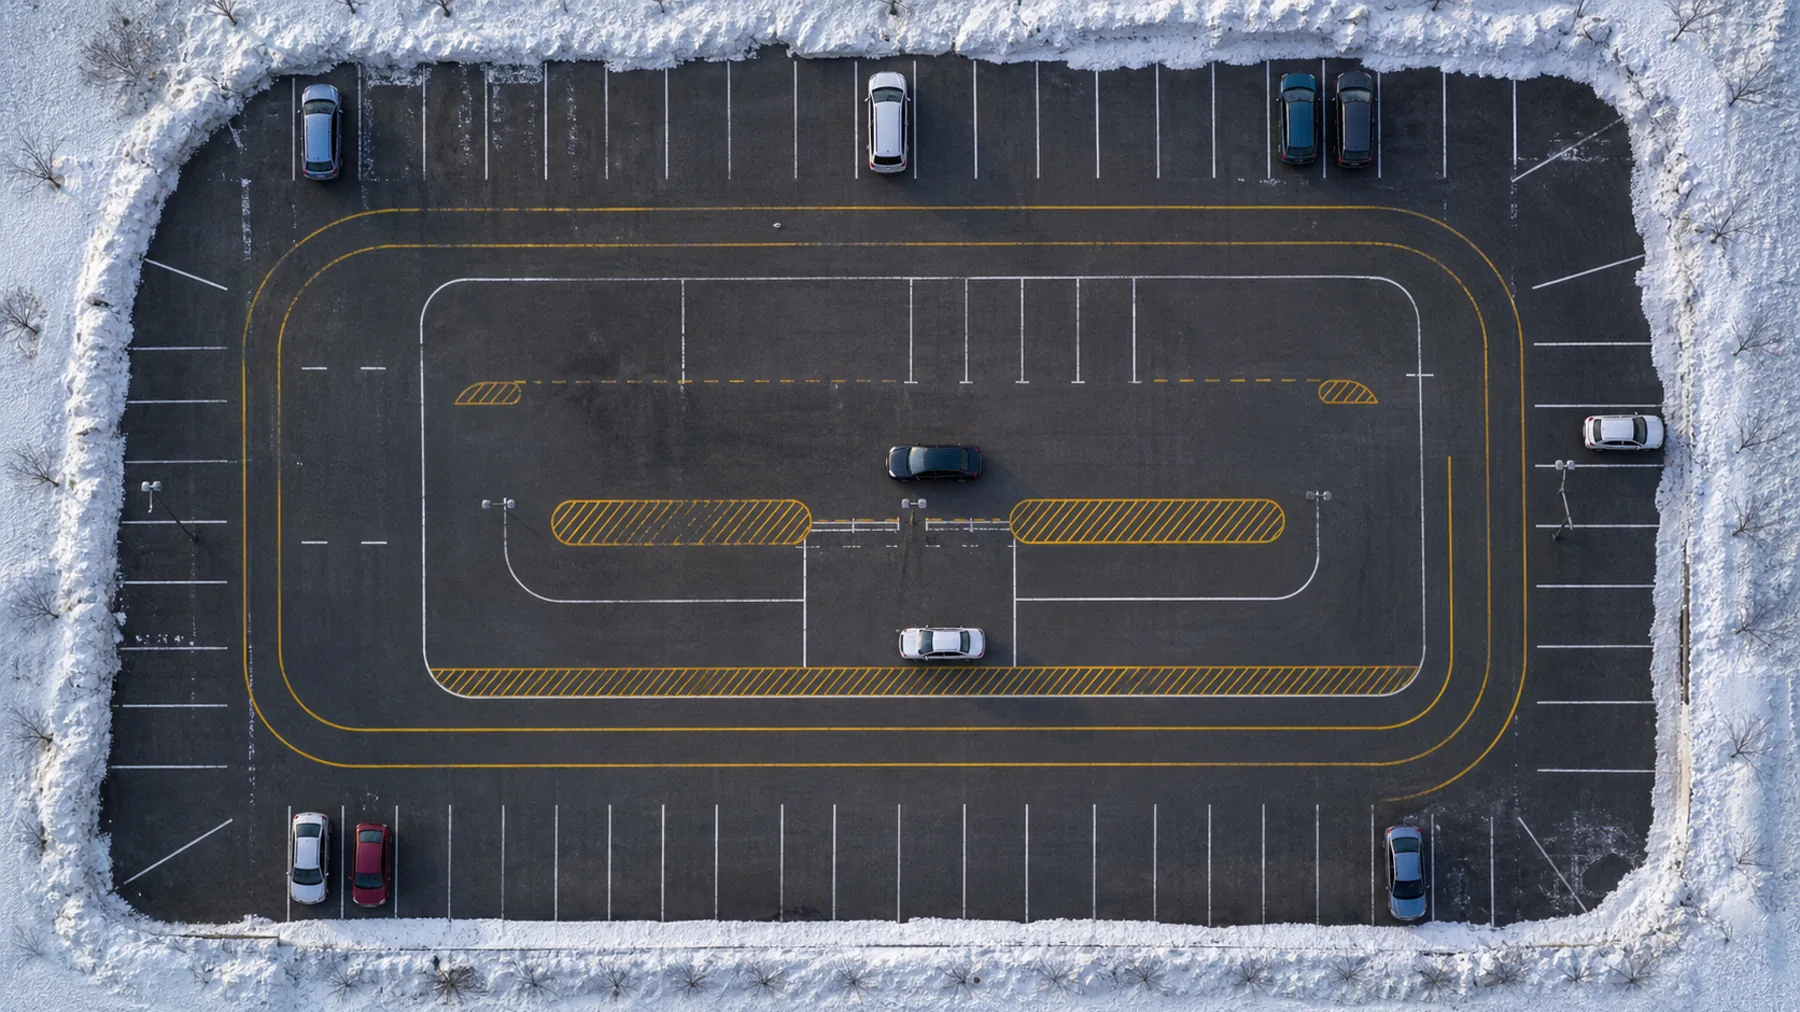
The middle centre in the 2022 release passed 73.31% of its road tests, and the release spans 28.23 percentage points from end to end, which is the whole reason a single provincial figure is not much use to anybody choosing where to book.
What the 2022 release holds
Median pass rate across the release
73.31%
The middle centre when all 65 rows are lined up by pass rate
Computed by us from the CBC freedom of information release of Ontario DriveTest results (2022 data)verified 2026-08-27Rows in the release
65
56 named centres and 9 temporary testing locations
CBC News freedom of information release of Ontario DriveTest results (2022 data)verified 2026-08-27Road tests counted across those rows
1,275,813
Every test the release records against a centre
Computed by us from the CBC freedom of information release of Ontario DriveTest results (2022 data)verified 2026-08-27The data year the release covers
2022
One year, one snapshot. A newer year lands beside this one rather than over it
CBC News freedom of information release of Ontario DriveTest results (2022 data)verified 2026-08-27Two of these four are our own arithmetic over the released rows rather than figures the release states, and their source line says so. Every figure covers the 2022 data year.
How to read the table before you read it
Four things about the release, put before the figures rather than after them, because a caveat printed under a table has already been skipped.
What the release contains
Every row the Ministry of Transportation released for the 2022 data year: 56 named DriveTest centres, 9 temporary testing locations, each with a road test pass rate and the number of road tests behind it.
How locations are added
We attach municipalities and addresses for 56 permanent centres from the verified DriveTest list. The release and location list carry no map coordinates, so this table does not calculate distance.
The rule we apply to a row
A row is transcribed from the stored release rather than retyped out of an article, and it is never adjusted, rounded further or dropped for being small. A quiet centre stays in the table with its own test count printed beside it.
What the ranking does not tell you
Rank orders one column and nothing else. It is not a measure of the examiners, it does not describe the roads a centre tests on, and it cannot tell you your own chance of passing.
Every row in the 2022 release
Every one of the 65 rows in the 2022 release, highest pass rate first, with the number of road tests behind each rate and the distance from the median of 73.31% that we work out from these rows.
CBC News freedom of information release of Ontario DriveTest results (2022 data)verified 2026-08-27Sorted by pass rate. Showing 65 of 65 rows, filtered to every row.
The table is written into this page whole, in pass rate order, so it reads the same with scripts switched off. The controls reorder rows that are already here and hide the ones a filter excludes. Rank is out of 65, and centres on the same pass rate share a rank. The municipality under a permanent centre comes from the verified DriveTest centre list, not from the road test release.
How the release is spread out
Every row counted once into a five point band, so the shape of the release is visible without reading 65 lines of table.
The widest gap in the release runs from 88.13% at Bancroft down to 59.90% at Brampton, which is +28.23 percentage points end to end.
One number the release will not settle
How the centre locations are joined
Road tests in Ontario are delivered by DriveTest under contract to the Ministry of Transportation, so the ministry holds the results. They were asked for under Ontario's Freedom of Information and Protection of Privacy Act, and our copy of the released dataset is stored in the repository beside the code that reads it. Every row above is transcribed from that file rather than retyped out of an article.
The road test release does not carry addresses. We match its centre names to the official DriveTest list, which supplies a municipality and address for 56 permanent centres. That makes 56 centre pages complete enough for search. The location source does not provide coordinates, so the site does not calculate distance.
9 of the rows are temporary testing locations rather than named permanent centres. They stay in the table and in the ranking because the release contains them, and they are filterable above, but we cannot tell from the release whether a reader can still book a test at one.
What a pass rate at a centre actually measures
A centre pass rate is not a difficulty score and it cannot predict one person's result. It records the people who chose to book there during the data year. It does not separate first attempts from later attempts or adjust for who travelled into the area.
A high pass rate is not proof that the examiners at that centre are soft, and a low one is not proof that they are harsh. A centre measures the roads around it, the traffic on them and the people who book there. A rural centre runs its test on quiet two lane roads with a candidate group that has usually practised on those same roads. A centre in a dense suburb runs the same test through heavy traffic and multi lane turns, which is pressure that has nothing to do with the examiner sitting beside you.
The mix of candidates matters as much as the route. Centres differ in how many first attempts they see, how many people arrive after a course, and how far people travel to reach them. The provincial auditor general found drivers travelling away from their home centre to test somewhere with better odds, and put the difference for one such pair at 22 percentage points. People already act on this information. We would rather they acted on it with the whole table in front of them and the caveats attached.
Each centre page also gives an approximate 95% margin of error for its rate. We compute it as 1.96 times the square root of p(1-p)/n, where p is the centre's pass rate as a proportion and n is its recorded road test count. This describes sampling uncertainty only. It does not correct for different roads, traffic, examiners or candidate groups.
Sources
Two of the figures on this page are ours rather than the release's: the median and the distance from it. Both are arithmetic over the rows in the table above, and both carry a source line that says so.
CBC News freedom of information release of Ontario DriveTest results (2022 data)
Verified 2026-08-27
Covers the 2022 data year.
Computed by us from the CBC freedom of information release of Ontario DriveTest results (2022 data)
Verified 2026-08-27
Median and volume weighted figures are our own arithmetic over the per centre rows in that release, not numbers the release states.
Office of the Auditor General of Ontario, value for money audit of DriveTest (2023)
Verified 2026-08-27
Figures as published in the audit, with a follow up review published in 2025.
DriveTest, alphabetical centre list
Verified 2026-09-15